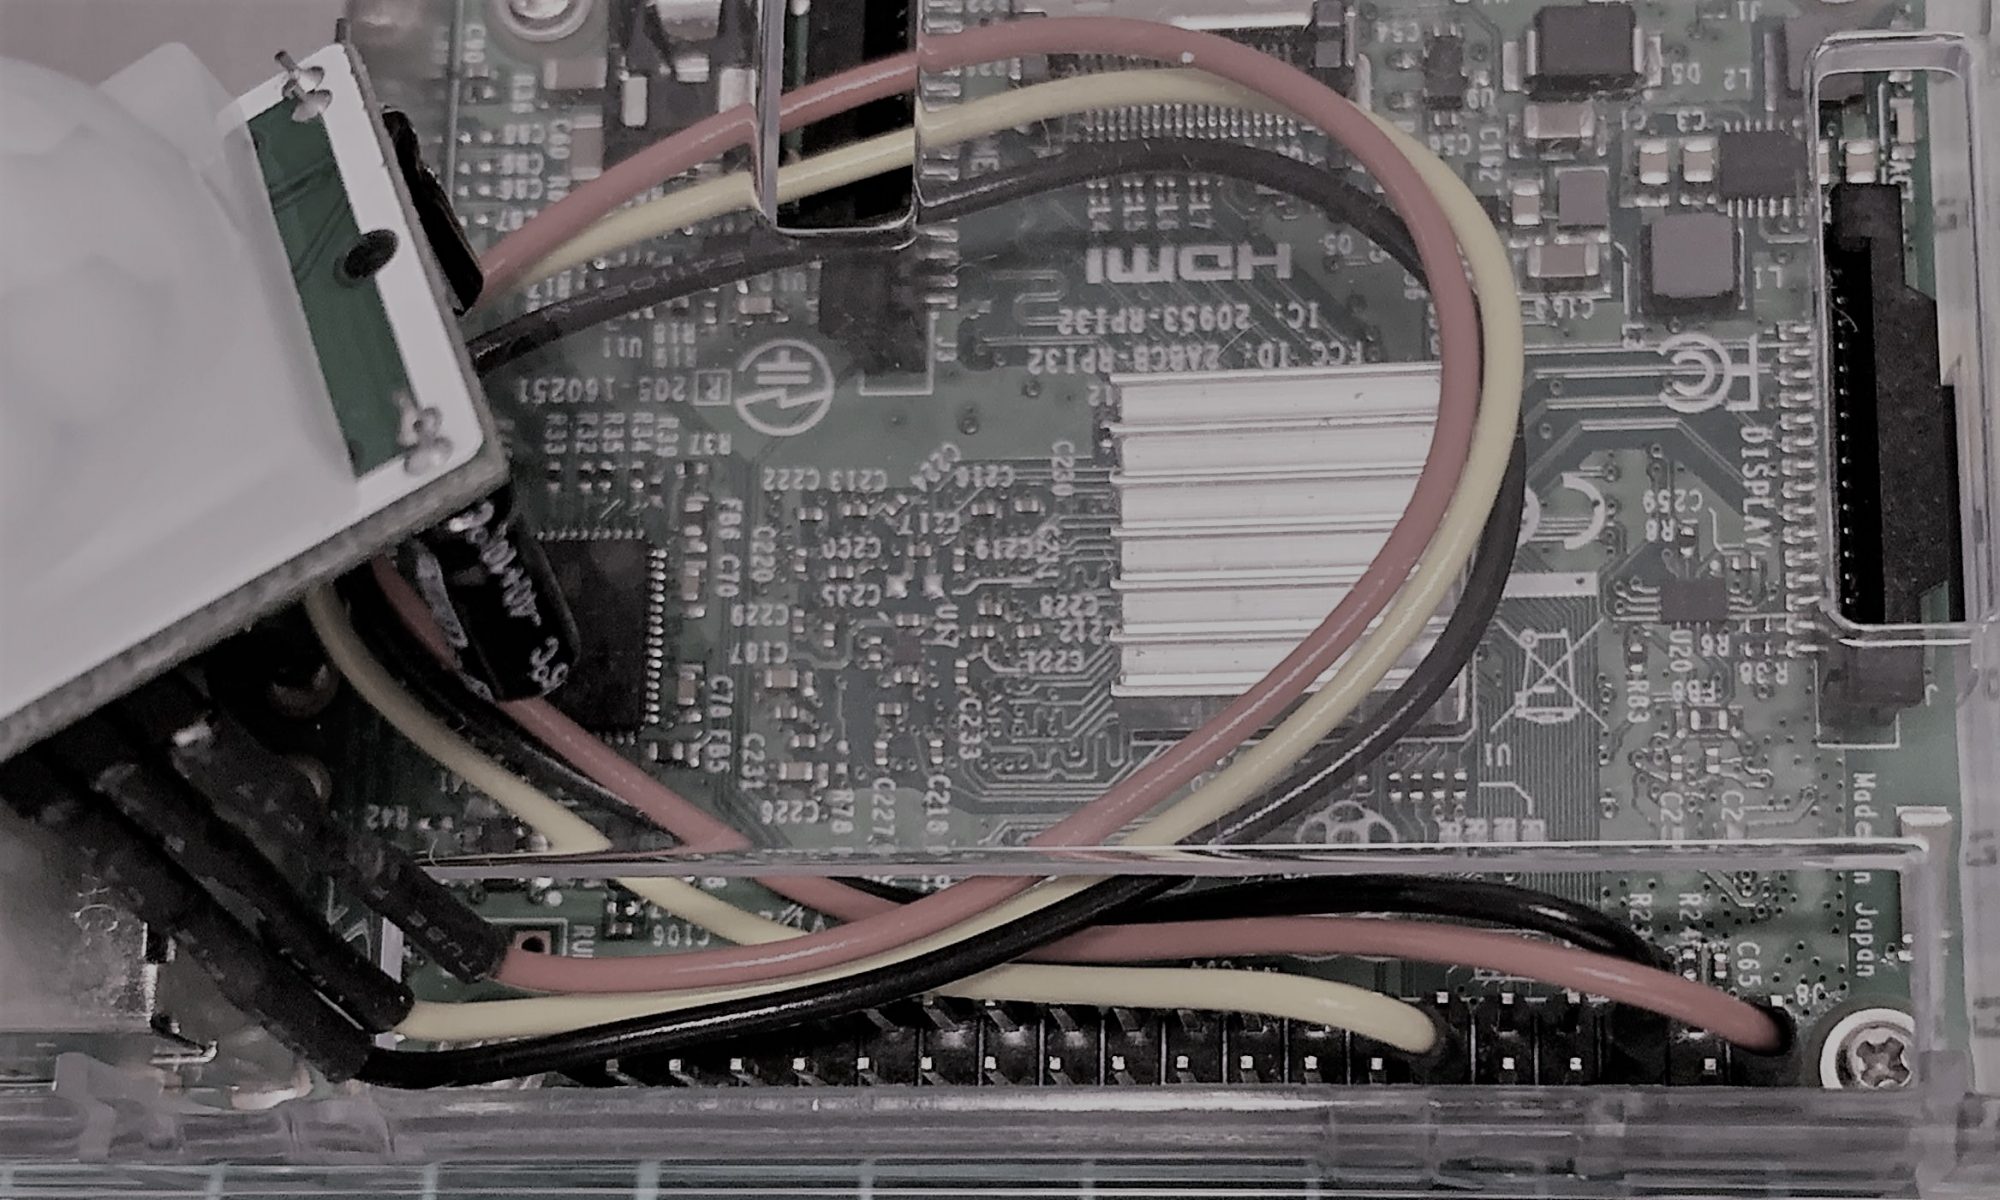

ラズパイを使って、LCDタッチパネル画面を作ったので紹介します。
センサやカメラをラズパイに接続して、タッチパネル画面上で操作することが目的です。特殊な技術は何も使っていないので、手軽に実現できると思います。ラズパイで使えるタッチパネルは安いもので数千円程度なので、自慢の装置にタッチパネルを追加するのも面白そうですね。
今回は、タッチパネルを使って以下の機能を実現しました。
- 7インチ(800×480)タッチパネルLCDを使ってタッチパネル操作を実現
- 温度、湿度の状態をタッチパネル画面にリアルタイムに表示
- 温度、湿度の変化をグラフ化
- 温度、湿度のデータをログファイル(csv形式)に出力
- カメラ映像をタッチパネル画面に表示
- カメラ映像を使ったラプラス撮影
タッチパネル画面の全体構成
今回作ったタッチパネル画面は、センサ制御とカメラ映像の2つの機能に分かれます。
1.センサ制御
温湿センサーのデータを取得して、タッチパネル画面に表示します。また、温度、湿度データの変化をグラフ化し、後からデータとして確認できるようファイルに出力します。
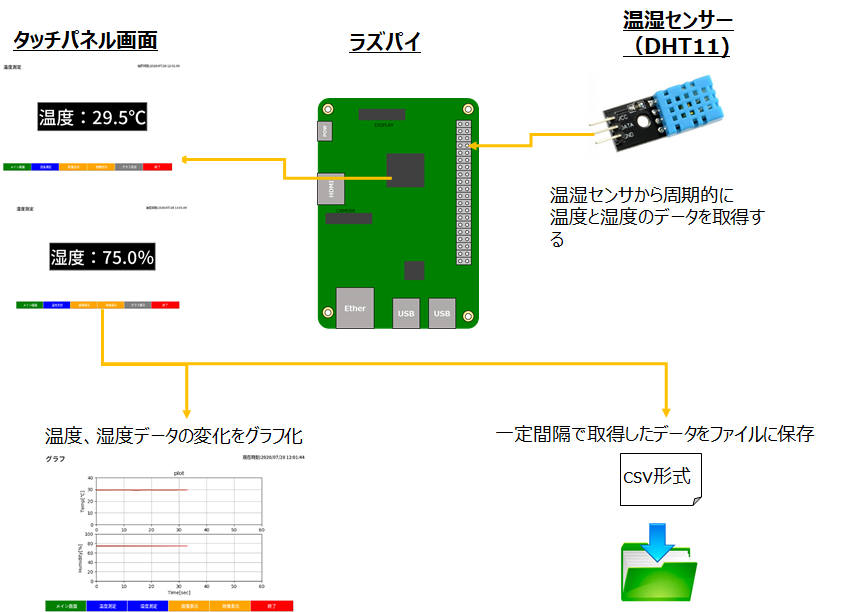
2.カメラ映像
タッチパネル画面にカメラ映像を表示します。過去に撮影した画像もタッチパネル画面上で選択して表示できます。また、タッチパネル画面上で、撮影の周期と期間を設定して、カメラ映像のラプラス撮影を行えるようにしました。
タッチパネル画面の配置と切替手法
タッチパネル画面(フレーム)配置と切替手法にについて紹介します。
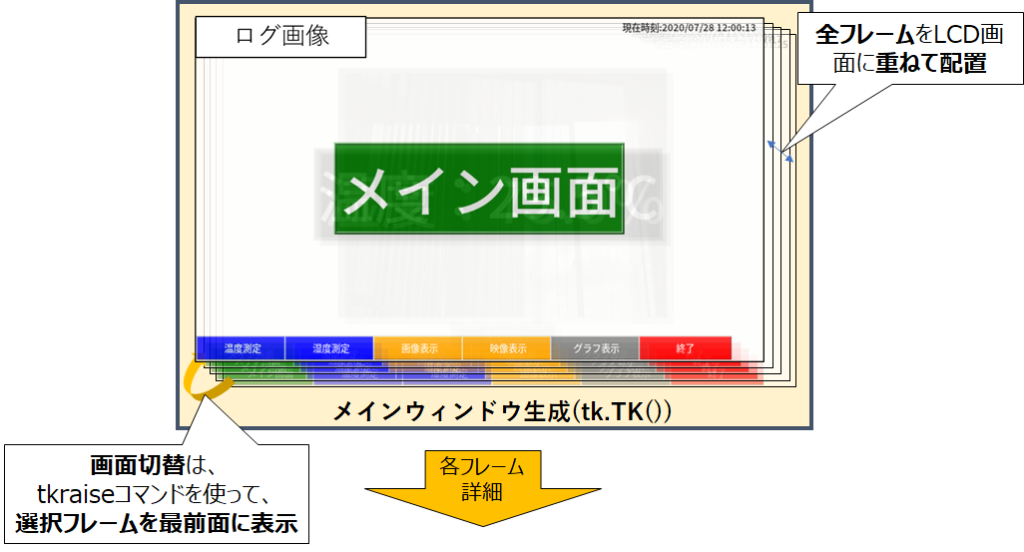
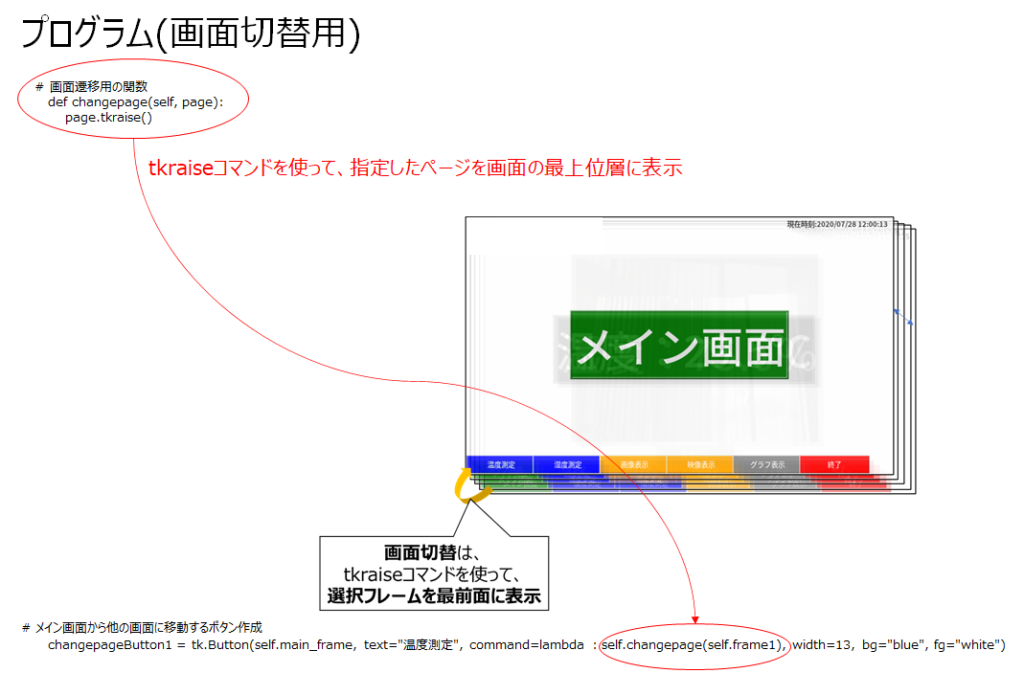
まず、メインウィンドウを生成し、全フレームをメインウィンドウ上に重ねて配置します。画面切替は、「tkraiseコマンド」を使って選択したフレームを最前面に表示する構成です。この方法が一番シンプルで、画面切替もスムーズに行うことができました。
タッチパネル画面の配置と切替イメージは以下です。
組み込みモジュール
今回は、開発言語として「Python」を使用しています。タッチパネル画面表示用のGUI開発には、Pythonの標準ライブラリの「Tkinter」を使い、測定データのグラフ化は「numpy」と「matplotlib」で行いました。センサからのデータ取得や長時間のログファイル出力などは、Tkinterの別スレッドで処理する必要があるので、「threading」もインポートしています。また、カメラ映像の表示には、「cv2」「PIL.Image」「PIL.ImageTK」も必要です。
■numpy
Pythonの拡張モジュールで、数値計算をより高速に処理できるようになります。機械学習にもよく利用されており、大量のデータ処理もNumPyを利用することで短縮できます。
以下のコマンドでインストール
$ sudo apt-get install python-numpy
$ sudo apt-get install python3-numpy
■matplotlib
Matplotlibは、NumPyのためのグラフ描画ライブラリです。
以下のコマンドでインストール
$ sudo apt-get install python-matplotlib
$ sudo apt-get install python3-matplotlib
■PIL(Python Imaging Library)
Pythonの画像処理ライブラリです。
$ sudo apt-get install python-pil.image
$ sudo apt-get install python3-pil.image

$ sudo apt-get install python-pil.imagetk
$ sudo apt-get install python3-pil.imagetk
本プログラムで組み込んだモジュールは以下です。
# tkinter
import tkinter as tk
from tkinter import filedialog as tkFileDialog

#時間、時刻
from time import sleep
import time
import datetime

#温湿センサ(DHT11)
import RPi.GPIO as GPIO
import dht11

#スレッド処理
import threading

#映像表示
import cv2
import numpy as np
import PIL.Image, PIL.ImageTk

#グラフ表示
import matplotlib.pyplot as plt
from matplotlib.backends.backend_tkagg import FigureCanvasTkAgg

#csvファイル
import csv
プログラムの初期化処理
ここでは、クラスを定義して、GPIOピンのモード指定や変数の初期化を行い、カメラの設定とメインウィンドウの初期設定しています。
class App(tk.Tk):
    # 初期設定
    def __init__(self, *args, **kwargs):
        #GPIOピン番号のモード指定
        GPIO.setmode(GPIO.BCM)
        #グローバル変数の初期化
        self.temperature = "0"
        self.humidity = "0"

        # カメラ設定
        self.vcap = cv2.VideoCapture(0)
        #self.width = self.vcap.get(cv2.CAP_PROP_FRAME_WIDTH)
        #self.height = self.vcap.get(cv2.CAP_PROP_FRAME_HEIGHT)
        #LCDタッチパネル画面のサイズに合わせて映像サイズを固定
        self.width = 460
        self.height = 345

        # メインウィンドウの初期化
        tk.Tk.__init__(self, *args, **kwargs)

        # ウィンドウタイトルを決定
        self.title("Temperature & Humidity Change Page")

        # ウィンドウの大きさ(LCD画面の大きさに合わせて設定)
        self.geometry("800x480")

        # ウィンドウのグリッドを 1x1 にする
        self.grid_rowconfigure(0, weight=1)
        self.grid_columnconfigure(0, weight=1)
タッチパネル画面(メイン画面)
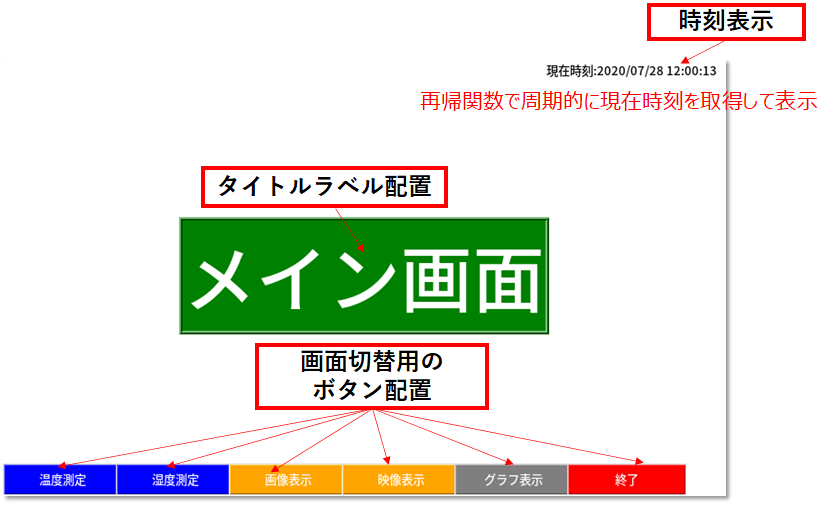
メイン画面なので、左上にロゴ画像と、右上に時刻を表示し、中央にタイトルラベルを配置しました。あと、画面の最下部に、画面切替用の切替ボタンを配置しています。
メイン画面のプログラムの中身は以下です。
#-----------------------------------main_frame(メイン画面)-----------------------------
        # メインページフレーム作成
        self.main_frame = tk.Frame(bg="white")
        self.main_frame.grid(row=0, column=0, sticky="nsew")
        # ロゴラベル作成
        self.logo = tk.PhotoImage(file='/home/user1/TKinter/logo.png')
        self.logoLabel = tk.Label(self.main_frame, image=self.logo, borderwidth=0)
        # 時刻表示ラベル作成
        self.datetime = datetime.datetime.now().strftime("%Y/%m/%d %H:%M:%S")
        self.time = tk.StringVar()
        self.time.set("現在時刻:" + str(self.datetime) )
        self.timeLabel = tk.Label(self.main_frame, textvariable=self.time, font=('Helvetica', '10'),fg="black", bg="white")
        # タイトルラベル作成
        self.titleLabel = tk.Label(self.main_frame, text="メイン画面", font=('Helvetica', '60'), borderwidth=4, relief="ridge", fg="white",bg="green")
        # メイン画面から他の画面に移動するボタン作成
        self.changepageButton1 = tk.Button(self.main_frame, text="温度測定", command=lambda : self.changepage(self.frame1), width=13, bg="blue", fg="white")
        self.changepageButton2 = tk.Button(self.main_frame, text="湿度測定", command=lambda : self.changepage(self.frame2), width=13, bg="blue", fg="white")
        self.changepageButton3 = tk.Button(self.main_frame, text="画像表示", command=lambda : self.changepage(self.frame3), width=13, bg="orange", fg="white")
        self.changepageButton4 = tk.Button(self.main_frame, text="映像表示", command=lambda : self.changepage(self.frame4), width=13, bg="orange", fg="white")
        self.changepageButton5 = tk.Button(self.main_frame, text="グラフ表示", command=lambda : self.changepage(self.frame5), width=13, bg="purple", fg="white")
        self.changepageButton6 = tk.Button(self.main_frame, text="終了", command=self._quit, width=13, bg="red", fg="white")
        # ウィジェット配置
#---- place ----
        self.logoLabel.place(x=0, y=0)
        self.timeLabel.place(x=600, y=0)
        self.titleLabel.place(x=400, y=240, anchor='center')
        self.changepageButton1.place(x=0, y=448)
        self.changepageButton2.place(x=125, y=448)
        self.changepageButton3.place(x=250, y=448)
        self.changepageButton4.place(x=375, y=448)
        self.changepageButton5.place(x=500, y=448)
        self.changepageButton6.place(x=625, y=448)
#--------------------------------------------------------------------------
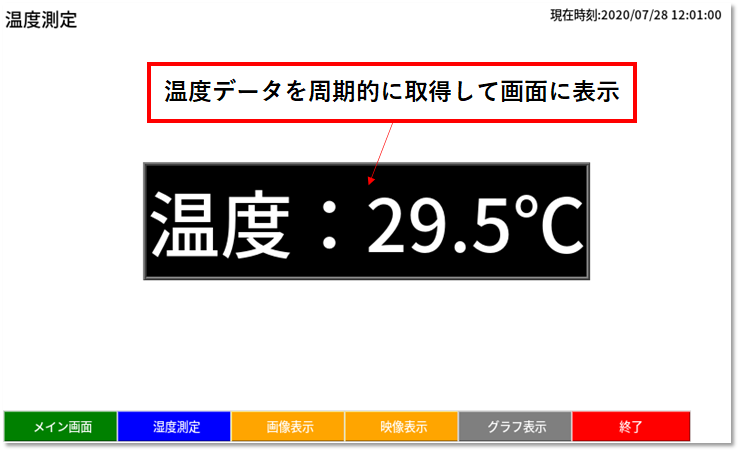
タッチパネル画面(温度湿度測定)
まず、センサからの温湿度データの取得には時間がかかるので、GUI画面表示とは別スレッドで処理をおこなっています。イベントループ(mainloop())内で処理すると、画面表示が待ち状態になって表示が固まります。
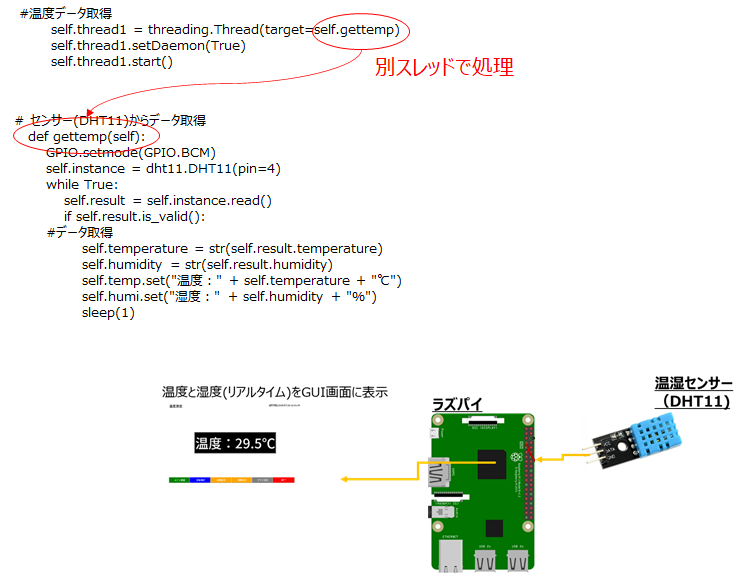
この画面は、センサから取得したデータを周期的に画面に表示します。温度や湿度などセンサから取得したデータを画面でリアルタイムに確認することができます。
温度測定画面のプログラムの中身は以下です。
#-----------------------------------frame1(温度表示)---------------------------------
        # 移動先フレーム作成
        self.frame1 = tk.Frame(bg="white")
        self.frame1.grid(row=0, column=0, sticky="nsew")
        # 画面ラベル表示
        self.monLabel = tk.Label(self.frame1, text="温度測定", font=('Helvetica', '15'),fg="black", bg="white")
        # 時刻表示ラベル表示
        self.time.set("現在時刻:" + str(self.datetime) )
        self.timeLabel = tk.Label(self.frame1, textvariable=self.time, font=('Helvetica', '10'),fg="black", bg="white")
        # 温度表示ラベル作成
        self.temp = tk.StringVar()
        self.temp.set("温度:" + self.temperature + "℃")
        self.tempLabel = tk.Label(self.frame1, textvariable=self.temp, font=('Helvetica', '60'), borderwidth = 4, relief="ridge", fg="white",bg="black")
        # フレーム1から他の画面に移動するボタン
        self.changepageButton1 = tk.Button(self.frame1, text="メイン画面", command=lambda : self.changepage(self.main_frame), width=13, bg="green", fg="white")
        self.changepageButton2 = tk.Button(self.frame1, text="湿度測定", command=lambda : self.changepage(self.frame2), width=13, bg="blue", fg="white")
        self.changepageButton3 = tk.Button(self.frame1, text="画像表示", command=lambda : self.changepage(self.frame3), width=13, bg="orange", fg="white")
        self.changepageButton4 = tk.Button(self.frame1, text="映像表示", command=lambda : self.changepage(self.frame4), width=13, bg="orange", fg="white")
        self.changepageButton5 = tk.Button(self.frame1, text="グラフ表示", command=lambda : self.changepage(self.frame5), width=13, bg="purple", fg="white")
        self.changepageButton6 = tk.Button(self.frame1, text="終了", command=self._quit, width=13, bg="red", fg="white")
        # ウィジェット配置
        self.monLabel.place(x=0, y=0)
        self.timeLabel.place(x=600, y=0)
        self.tempLabel.place(x=400, y=240, anchor='center')
        self.changepageButton1.place(x=0, y=448)
        self.changepageButton2.place(x=125, y=448)
        self.changepageButton3.place(x=250, y=448)
        self.changepageButton4.place(x=375, y=448)
        self.changepageButton5.place(x=500, y=448)
        self.changepageButton6.place(x=625, y=448)
#--------------------------------------------------------------------------
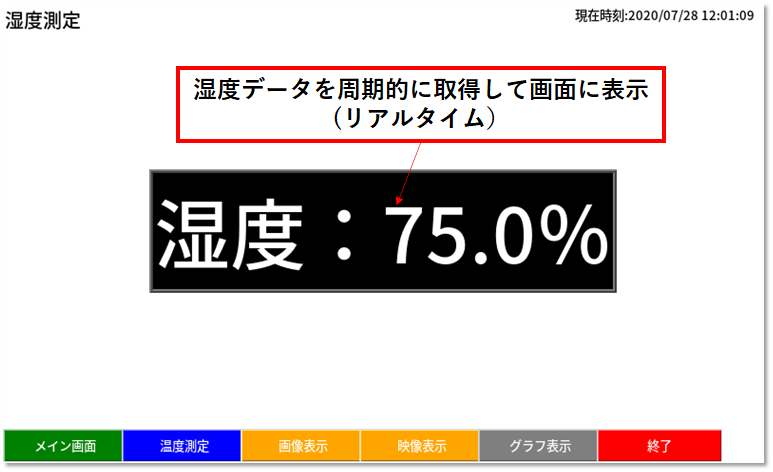
湿度測定画面も温度測定とほぼ同じです。いろんなセンサを取り付ける場合も、センサからのデータ取得は、別スレッド(もしくは別の機器)で処理する方が、画面の表示もスムーズにいくと思います。
湿度測定画面のプログラムの中身は以下です。(温度測定画面とほぼ同じです)
#-----------------------------------frame2(湿度表示)---------------------------------
        # 移動先フレーム作成
        self.frame2 = tk.Frame(bg="white")
        self.frame2.grid(row=0, column=0, sticky="nsew")
        # 画面ラベル表示
        self.monLabel = tk.Label(self.frame2, text="湿度測定", font=('Helvetica', '15'),fg="black", bg="white")
        # 時刻表示ラベル表示
        self.time.set("現在時刻:" + str(self.datetime) )
        self.timeLabel = tk.Label(self.frame2, textvariable=self.time, font=('Helvetica', '10'),fg="black", bg="white")
        # 湿度表示ラベル作成
        self.humi = tk.StringVar()
        self.humi.set("湿度:" + self.humidity + "%")
        self.humiLabel = tk.Label(self.frame2, textvariable=self.humi, font=('Helvetica', '60'), borderwidth = 4, relief="ridge", fg="white",bg="black")
        # フレーム2から他の画面に移動するボタン
        self.changepageButton1 = tk.Button(self.frame2, text="メイン画面", command=lambda : self.changepage(self.main_frame), width=13, bg="green", fg="white")
        self.changepageButton2 = tk.Button(self.frame2, text="温度測定", command=lambda : self.changepage(self.frame1), width=13, bg="blue", fg="white")
        self.changepageButton3 = tk.Button(self.frame2, text="画像表示", command=lambda : self.changepage(self.frame3), width=13, bg="orange", fg="white")
        self.changepageButton4 = tk.Button(self.frame2, text="映像表示", command=lambda : self.changepage(self.frame4), width=13, bg="orange", fg="white")
        self.changepageButton5 = tk.Button(self.frame2, text="グラフ表示", command=lambda : self.changepage(self.frame5), width=13, bg="gray50", fg="white")
        self.changepageButton6 = tk.Button(self.frame2, text="終了", command=self._quit, width=13, bg="red", fg="white")
        # ウィジェット配置
        self.monLabel.place(x=0, y=0)
        self.timeLabel.place(x=600, y=0)
        self.humiLabel.place(x=400, y=240, anchor='center')
        self.changepageButton1.place(x=0, y=448)
        self.changepageButton2.place(x=125, y=448)
        self.changepageButton3.place(x=250, y=448)
        self.changepageButton4.place(x=375, y=448)
        self.changepageButton5.place(x=500, y=448)
        self.changepageButton6.place(x=625, y=448)
#--------------------------------------------------------------------------
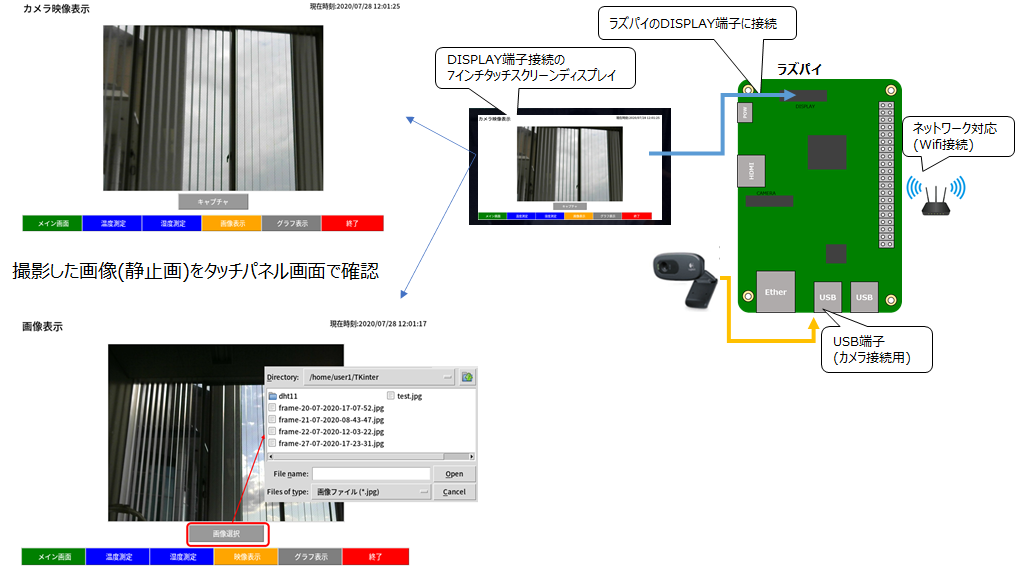
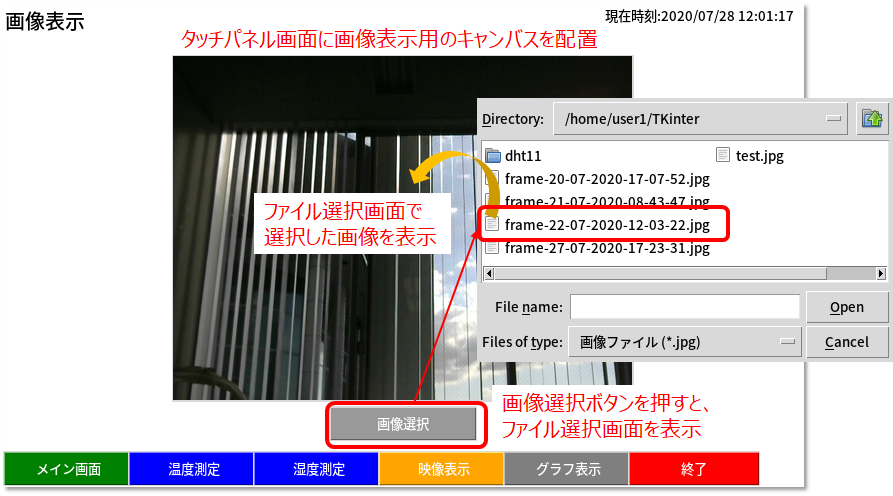
タッチパネル画面(画像表示)
この画面は、保存した画像をタッチパネル上で確認できるようにしています。「画像選択」ボタンを押すと、画像選択用のウィンドウが表示され、選択した画像をタッチパネル画面上に表示することができます。タッチパネル単体で画像が確認できると、ネットにつながってない環境でもすぐに画像を確認できるので便利だと思います。
画像表示画面のプログラムの中身は以下です。
#-----------------------------------frame3(画像表示)---------------------------------
        # 移動先フレーム作成
        self.frame3 = tk.Frame(bg="white")
        self.frame3.grid(row=0, column=0, sticky="nsew")
        # 画面ラベル表示
        self.monLabel = tk.Label(self.frame3, text="画像表示", font=('Helvetica', '15'),fg="black", bg="white")
        # 時刻表示ラベル表示
        self.time.set("現在時刻:" + str(self.datetime) )
        self.timeLabel = tk.Label(self.frame3, textvariable=self.time, font=('Helvetica', '10'),fg="black", bg="white")
        # 映像表示用のキャンバス作成
        self.canvas = tk.Canvas(self.frame3, width = self.width, height = self.height)
        self.canvas.place(x=400, y=225, anchor='center')
        self.img = PIL.Image.open(open('/home/user1/TKinter/frame-20-07-2020-17-07-52.jpg', 'rb'))
        self.img.thumbnail((self.width, self.height), PIL.Image.ANTIALIAS)
        self.img = PIL.ImageTk.PhotoImage(self.img)
        self.canvas.create_image(0, 0, image = self.img, anchor = tk.NW)

        # 画像選択ボタン
        self.sel_button = tk.Button(self.frame3, text="画像選択", command=self.openfile, width=15, bg="gray60", fg="white")
        # フレーム3から他の画面に移動するボタン
        self.changepageButton1 = tk.Button(self.frame3, text="メイン画面", command=lambda : self.changepage(self.main_frame), width=13, bg="green", fg="white")
        self.changepageButton2 = tk.Button(self.frame3, text="温度測定", command=lambda : self.changepage(self.frame1), width=13, bg="blue", fg="white")
        self.changepageButton3 = tk.Button(self.frame3, text="湿度測定", command=lambda : self.changepage(self.frame2), width=13, bg="blue", fg="white")
        self.changepageButton4 = tk.Button(self.frame3, text="映像表示", command=lambda : self.changepage(self.frame4), width=13, bg="orange", fg="white")
        self.changepageButton5 = tk.Button(self.frame3, text="グラフ表示", command=lambda : self.changepage(self.frame5), width=13, bg="purple", fg="white")
        self.changepageButton6 = tk.Button(self.frame3, text="終了", command=self._quit, width=13, bg="red", fg="white")
        # ウィジェット配置
        self.monLabel.place(x=0, y=0)
        self.timeLabel.place(x=600, y=0)
        self.sel_button.place(x=400, y=420, anchor='center')
        self.changepageButton1.place(x=0, y=448)
        self.changepageButton2.place(x=125, y=448)
        self.changepageButton3.place(x=250, y=448)
        self.changepageButton4.place(x=375, y=448)
        self.changepageButton5.place(x=500, y=448)
        self.changepageButton6.place(x=625, y=448)
#--------------------------------------------------------------------------
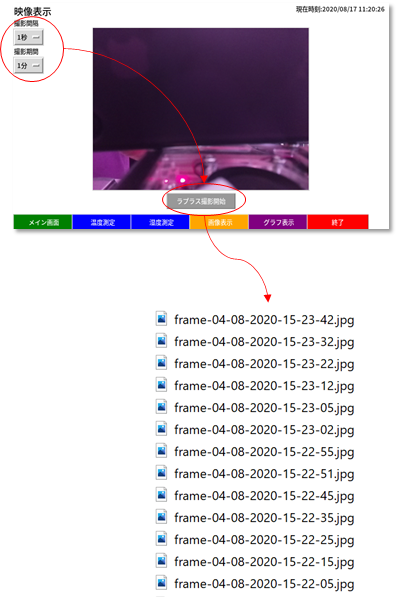
タッチパネル画面(映像表示)
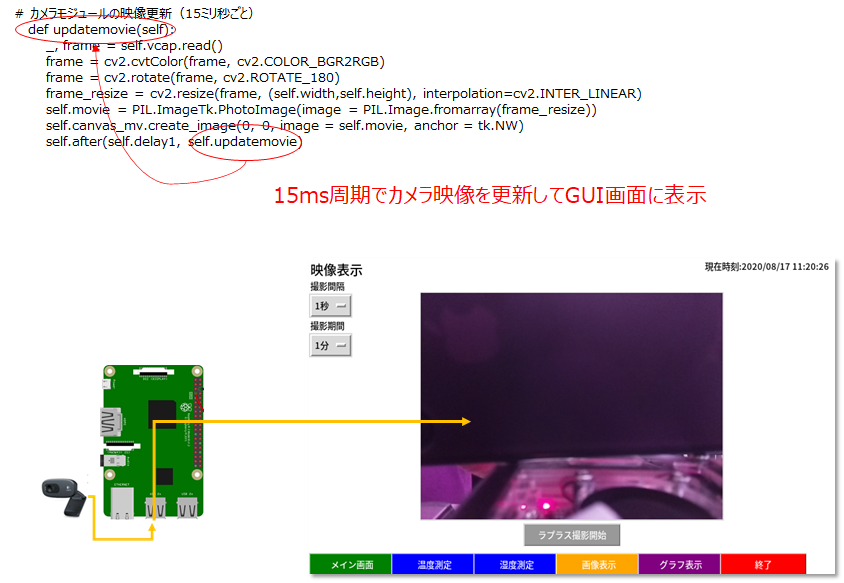
この画面は、ラズパイに接続したカメラ映像をタッチパネル画面にリアルタイムに表示します。また、カメラ映像を使って、ラプラス撮影を行えるようにしました。
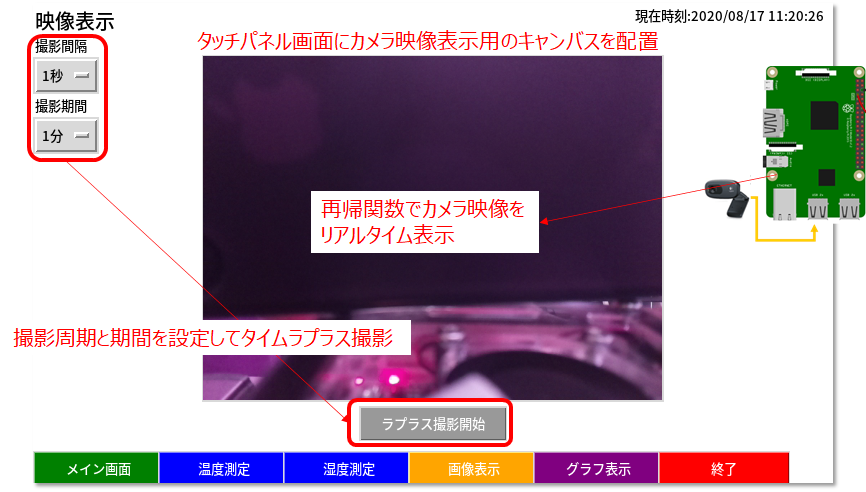
映像の撮影間隔と期間を設定して、[ラプラス撮影開始]ボタンを押すと、バックグラウンドでラプラス撮影を実行します。ボタンを押すと、撮影間隔ごとに画像が保存されます。ここでの想定は、植物を1時間単位で撮影して数か月後に花が咲いたいたらラプラス動画に変換して、成長の過程を見たりすることを想定しています。夏休みの課題で、メダカの成長や植物の成長を観察するのにも活用できそうです。
カメラ画像の更新は、15ms周期でカメラ映像を更新しています。
映像表示画面のプログラムの中身は以下です。
#-----------------------------------frame4(カメラ映像表示)---------------------------------
        # 移動先フレーム作成
        self.frame4 = tk.Frame(bg="white")
        self.frame4.grid(row=0, column=0, sticky="nsew")
        # 画面ラベル表示
        self.monLabel = tk.Label(self.frame4, text="映像表示", font=('Helvetica', '15'),fg="black", bg="white")
        self.interval1menuLabel = tk.Label(self.frame4, text="撮影間隔", font=('Helvetica', '10'),fg="black", bg="white")
        self.period1menuLabel = tk.Label(self.frame4, text="撮影期間", font=('Helvetica', '10'),fg="black", bg="white")
        # 時刻表示ラベル表示
        self.time.set("現在時刻:" + str(self.datetime) )
        self.timeLabel = tk.Label(self.frame4, textvariable=self.time, font=('Helvetica', '10'),fg="black", bg="white")

    # 映像表示用のキャンバス作成
        self.canvas_mv = tk.Canvas(self.frame4, width=self.width, height=self.height)
        self.canvas_mv.place(x=400, y=225, anchor='center')
    # 映像の更新
        self.delay1 = 15
        self.updatemovie()

        # Capgureボタン
        self.snap_button = tk.Button(self.frame4, text="ラプラス撮影開始", command=self.callback_capture , width=15, bg="gray60", fg="white")

        # 選択メニュー(撮影間隔)
        self.interval1 = tk.StringVar()
        self.interval1.set("1秒")
        self.menu_interval1 = tk.OptionMenu(self.frame4, self.interval1, "1秒","10秒","1分")
        # 選択メニュー(撮影期間)
        self.period1 = tk.StringVar()
        self.period1.set("1分")
        self.menu_period1 = tk.OptionMenu(self.frame4, self.period1, "1分","10分","1時間")
        # フレーム4から他の画面に移動するボタン
        self.changepageButton1 = tk.Button(self.frame4, text="メイン画面", command=lambda : self.changepage(self.main_frame), width=13, bg="green", fg="white")
        self.changepageButton2 = tk.Button(self.frame4, text="温度測定", command=lambda : self.changepage(self.frame1), width=13, bg="blue", fg="white")
        self.changepageButton3 = tk.Button(self.frame4, text="湿度測定", command=lambda : self.changepage(self.frame2), width=13, bg="blue", fg="white")
        self.changepageButton4 = tk.Button(self.frame4, text="画像表示", command=lambda : self.changepage(self.frame3), width=13, bg="orange", fg="white")
        self.changepageButton5 = tk.Button(self.frame4, text="グラフ表示", command=lambda : self.changepage(self.frame5), width=13, bg="purple", fg="white")
        self.changepageButton6 = tk.Button(self.frame4, text="終了", command=self._quit, width=13, bg="red", fg="white")
        # ウィジェット配置
        self.monLabel.place(x=0, y=0)
        self.interval1menuLabel.place(x=0, y=30)
        self.menu_interval1.place(x=0, y=54)
        self.period1menuLabel.place(x=0, y=90)
        self.menu_period1.place(x=0, y=114)

        self.timeLabel.place(x=600, y=0)
        self.snap_button.place(x=400, y=420, anchor='center')
        self.changepageButton1.place(x=0, y=448)
        self.changepageButton2.place(x=125, y=448)
        self.changepageButton3.place(x=250, y=448)
        self.changepageButton4.place(x=375, y=448)
        self.changepageButton5.place(x=500, y=448)
        self.changepageButton6.place(x=625, y=448)
#--------------------------------------------------------------------------
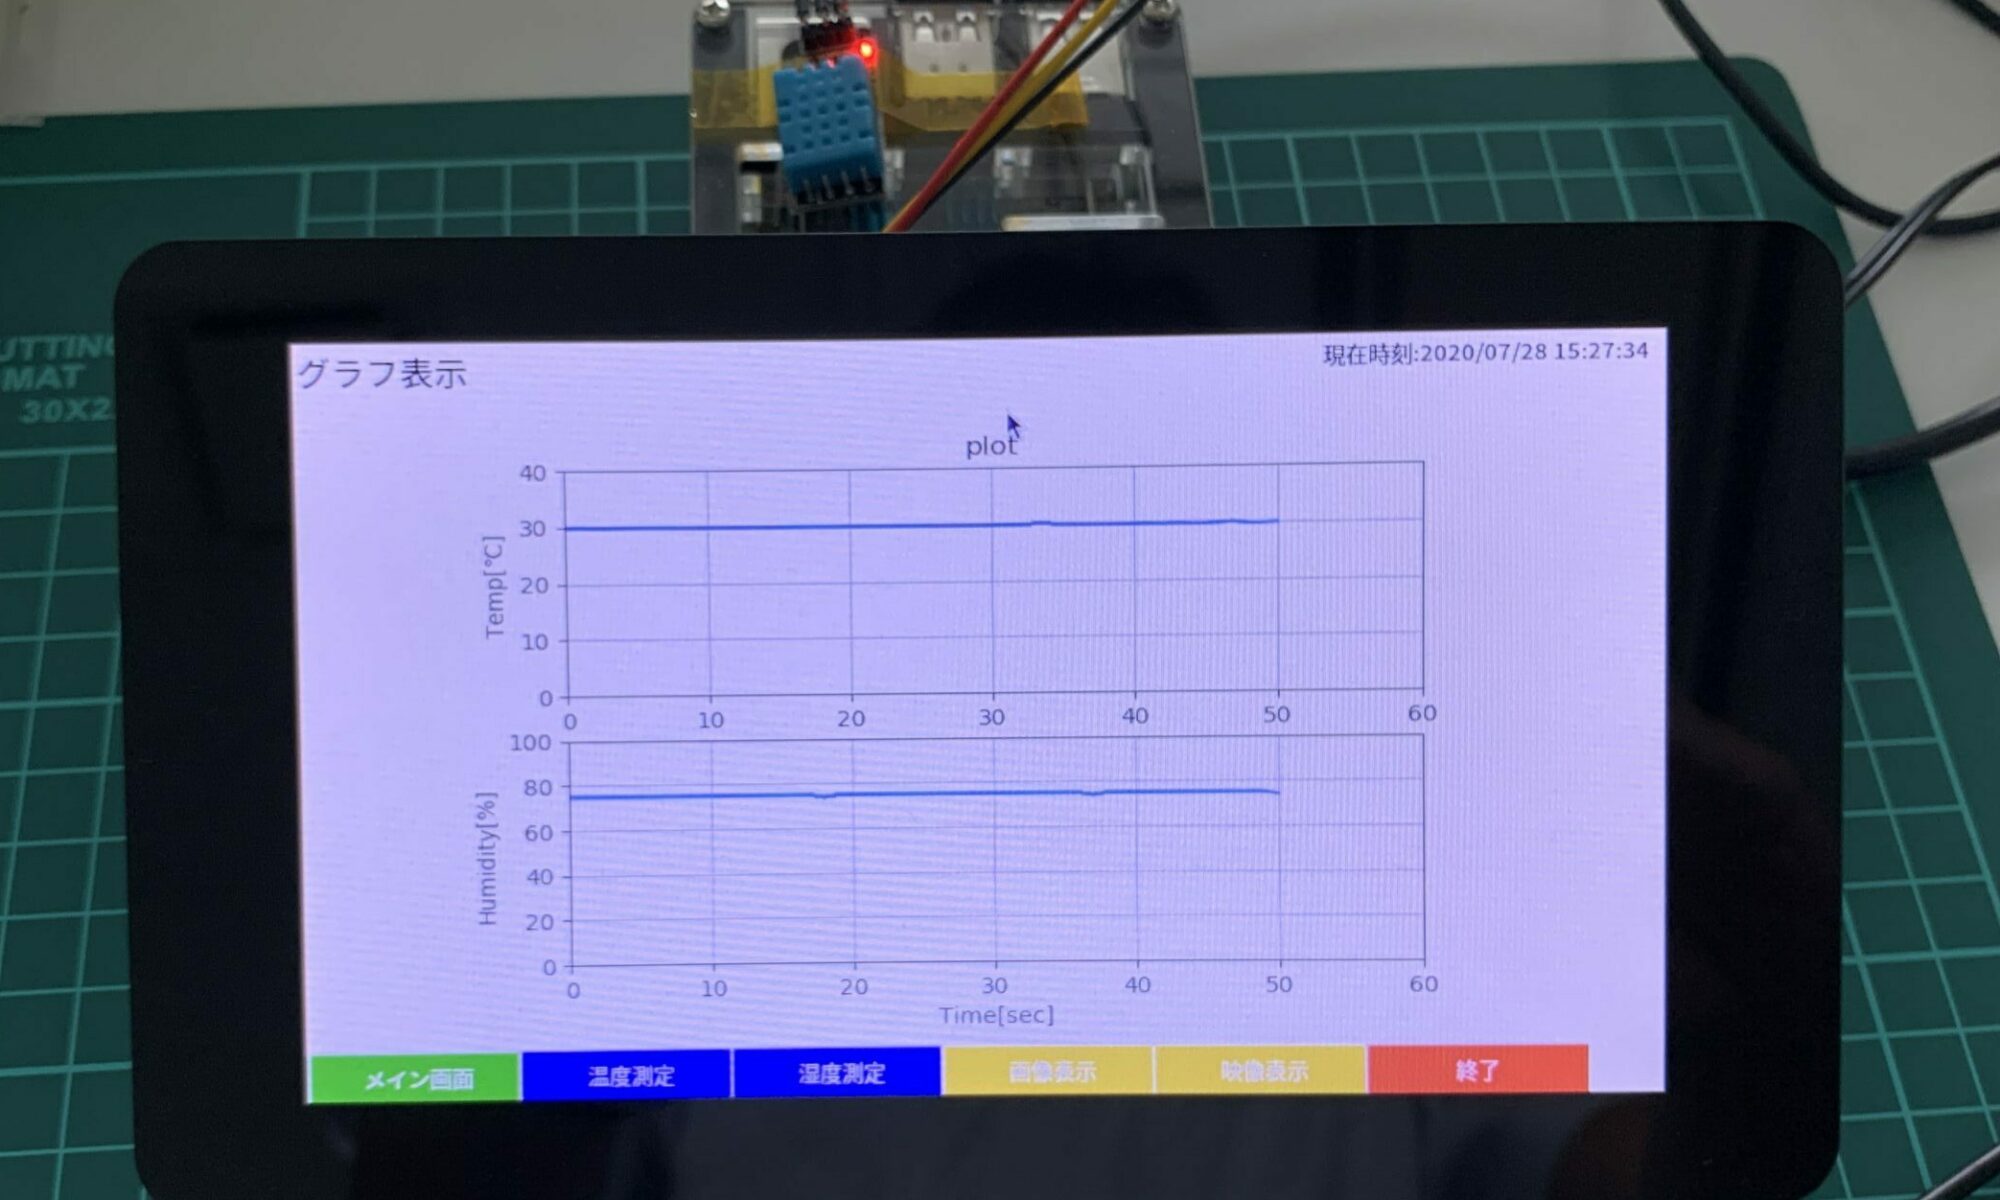
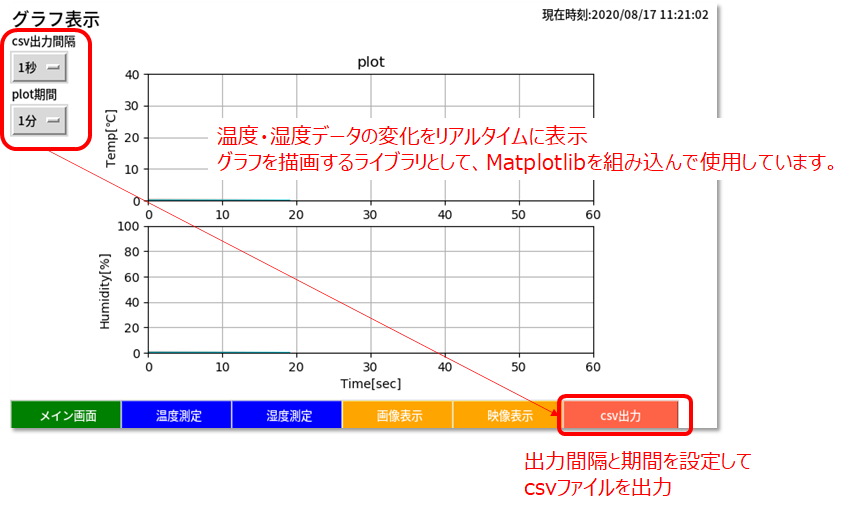
タッチパネル画面(グラフ化)
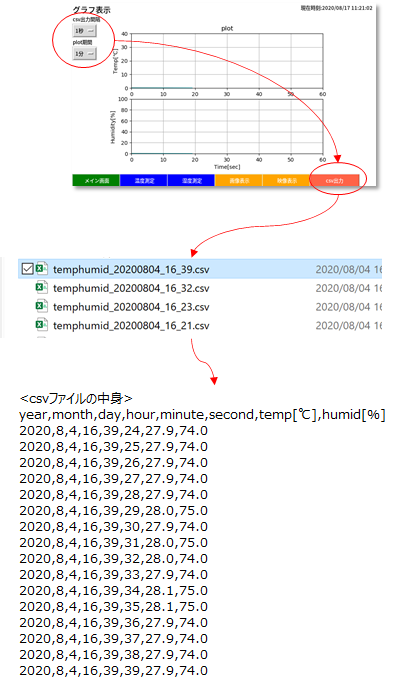
この画面は、センサで測定した温度、湿度データを時系列に表示して、タッチパネル画面で確認できます。plot期間を変更すると、グラフのプロット期間も変更されます。1時間の温度変化などをリアルタイムで確認したい場合は、タッチパネル画面上ですぐに見れるので便利です。あと、取得したデータを保存して、後から活用したい場合もあるので、ログファイル(csv形式)で保存できるようにしました。センサから取得したデータを蓄積して、データベース化すると、面白いことが発見できそうですね。
グラフ化画面のプログラムの中身は以下です。
#-----------------------------------frame5(グラフ表示)---------------------------------
        # 移動先フレーム作成
        self.frame5 = tk.Frame(bg="white")
        self.frame5.grid(row=0, column=0, sticky="nsew")
        # 画面ラベル表示
        self.monLabel = tk.Label(self.frame5, text="グラフ表示", font=('Helvetica', '15'),fg="black", bg="white")
        self.intervalmenuLabel = tk.Label(self.frame5, text="csv出力間隔", font=('Helvetica', '10'),fg="black", bg="white")
        self.periodmenuLabel = tk.Label(self.frame5, text="plot期間", font=('Helvetica', '10'),fg="black", bg="white")
        # 時刻表示ラベル表示
        self.time.set("現在時刻:" + str(self.datetime) )
        self.timeLabel = tk.Label(self.frame5, textvariable=self.time, font=('Helvetica', '10'),fg="black", bg="white")
        # グラフ表示用のキャンバス作成
        # prepare data
        self.y1 = []
        self.y1.append(float(self.temperature))
        self.y2 = []
        self.y2.append(float(self.humidity))
        #self.fig = plt.figure()
        self.fig = plt.figure(dpi=100, figsize=(6.5,4.1))
        # 温度グラフ
        self.ay1 = self.fig.add_subplot(211)
        self.ay1.set_xlim(0,60)
        self.ay1.set_ylim([0,40])
        self.ay1.plot(self.y1)
        self.ay1.set_title('plot')
        #self.ay1.set_xlabel('Time[sec]')
        self.ay1.set_ylabel('Temp[℃]')
        self.ay1.grid(True)
        # 湿度グラフ
        self.ay2 = self.fig.add_subplot(212)
        self.ay2.set_xlim(0,60)
        self.ay2.set_ylim([0,100])
        self.ay2.plot(self.y2)
        #self.ay2.set_title(' Humidity')
        self.ay2.set_xlabel('Time[sec]')
        self.ay2.set_ylabel('Humidity[%]')
        self.ay2.grid(True)

        self.canvas_graph = FigureCanvasTkAgg(self.fig, self.frame5)  # Generate canvas instance, Embedding fig in root
        self.canvas_graph.draw()
        #self.canvas_graph.get_tk_widget().pack(anchor=tk.NW)
        self.canvas_graph.get_tk_widget().place(x=400, y=235, anchor='center’)
 # 選択メニュー(plot間隔)
        self.interval = tk.StringVar()
        self.interval.set("1秒")
        self.menu_interval = tk.OptionMenu(self.frame5, self.interval, "1秒","10秒","1分")
        # 選択メニュー(plot期間)
        self.period = tk.StringVar()
        self.period.set("1分")
        self.menu_period = tk.OptionMenu(self.frame5, self.period, "1分","10分","1時間")

        self.delay3 = 1000
        self.drawgraph()

        # フレーム5から他の画面に移動するボタン
        self.changepageButton1 = tk.Button(self.frame5, text="メイン画面", command=lambda : self.changepage(self.main_frame), width=13, bg="green", fg="white")
        self.changepageButton2 = tk.Button(self.frame5, text="温度測定", command=lambda : self.changepage(self.frame1), width=13, bg="blue", fg="white")
        self.changepageButton3 = tk.Button(self.frame5, text="湿度測定", command=lambda : self.changepage(self.frame2), width=13, bg="blue", fg="white")
        self.changepageButton4 = tk.Button(self.frame5, text="画像表示", command=lambda : self.changepage(self.frame3), width=13, bg="orange", fg="white")
        self.changepageButton5 = tk.Button(self.frame5, text="映像表示", command=lambda : self.changepage(self.frame4), width=13, bg="orange", fg="white")
        self.changepageButton6 = tk.Button(self.frame5, text="csv出力", command=self.callback_writecsv, width=13, bg="tomato", fg="white")
        # ウィジェット配置
        self.monLabel.place(x=0, y=0)
        self.intervalmenuLabel.place(x=0, y=30)
        self.menu_interval.place(x=0, y=54)
        self.periodmenuLabel.place(x=0, y=90)
        self.menu_period.place(x=0, y=114)

        self.timeLabel.place(x=600, y=0)
        self.changepageButton1.place(x=0, y=448)
        self.changepageButton2.place(x=125, y=448)
        self.changepageButton3.place(x=250, y=448)
        self.changepageButton4.place(x=375, y=448)
        self.changepageButton5.place(x=500, y=448)
        self.changepageButton6.place(x=625, y=448)
#--------------------------------------------------------------------------

        #main_frameを一番上に表示
        self.main_frame.tkraise()

        #時刻データを更新(1秒周期)
        self.delay2 = 1000
        self.updatetime()

        #温度データ取得
        self.thread1 = threading.Thread(target=self.gettemp)
        self.thread1.setDaemon(True)
        self.thread1.start()
読み込んでいる関数は以下です。
   # 画面遷移用の関数
    def changepage(self, page):
        page.tkraise()

    # センサー(DHT11)からデータ取得
    def gettemp(self):
        GPIO.setmode(GPIO.BCM)
        self.instance = dht11.DHT11(pin=4)
        while True:
            self.result = self.instance.read()
            if self.result.is_valid():
		#データ取得
                self.temperature = str(self.result.temperature)
                self.humidity = str(self.result.humidity)
                self.temp.set("温度:" + self.temperature + "℃")
                self.humi.set("湿度:" + self.humidity + "%")
                sleep(1)

    # 時刻更新
    def updatetime(self):
        self.datetime = str(datetime.datetime.now().strftime("%Y/%m/%d %H:%M:%S"))
        self.time.set("現在時刻:" + self.datetime )
        self.after(self.delay2,self.updatetime)

    # カメラモジュールの映像更新(15ミリ秒ごと)
    def updatemovie(self):
        _, frame = self.vcap.read()
        frame = cv2.cvtColor(frame, cv2.COLOR_BGR2RGB)
        frame_resize = cv2.resize(frame, (self.width,self.height), interpolation=cv2.INTER_LINEAR)
        self.movie = PIL.ImageTk.PhotoImage(image = PIL.Image.fromarray(frame_resize))
        self.canvas_mv.create_image(0, 0, image = self.movie, anchor = tk.NW)
        self.after(self.delay1, self.updatemovie)

    # 画像選択ボタンの処理
    def openfile(self):
        self.fTyp=[('画像ファイル','*.jpg')]
        self.iDir='/home/ユーザ名/'
        #jpgファイルの選択
        pictfilename=tkFileDialog.askopenfilename(filetypes=self.fTyp,initialdir=self.iDir)
        #選択したjpgファイルを表示
        self.img = PIL.Image.open(open(pictfilename, 'rb'))
        self.img.thumbnail((self.width, self.height), PIL.Image.ANTIALIAS)
        self.img = PIL.ImageTk.PhotoImage(self.img)
        self.canvas.create_image(0, 0, image = self.img, anchor = tk.NW)

    # グラフ描画
    def drawgraph(self):
        # X軸(plot期間)を設定:1分/10分/1時間
        if self.period.get() == "1分":
            self.xlim = 60
        elif self.period.get()  == "10分":
            self.xlim = 600
        else: # 1時間
            self.xlim = 3600

        if len(self.y1) <= self.xlim:
            self.ay1.set_xlim(0,self.xlim)
            self.ay2.set_xlim(0,self.xlim)
            self.y1.append(float(self.temperature))
            self.y2.append(float(self.humidity))
        else:
            self.y1.clear()
            self.y1.append(float(self.temperature))
            self.ay1.clear()
            self.ay1.set_xlim(0,self.xlim)
            self.ay1.set_ylim([0,40])
            self.ay1.set_title('plot')
            #self.ay1.set_xlabel('Time[sec]')
            self.ay1.set_ylabel('Temp[℃]')
            self.ay1.grid(True)
            self.y2.clear()
            self.y2.append(float(self.humidity))
            self.ay2.clear()
            self.ay2.set_xlim(0,self.xlim)
            self.ay2.set_ylim([0,100])
            #self.ay2.set_title('plot')
            self.ay2.set_xlabel('Time[sec]')
            self.ay2.set_ylabel('Humidity[%]')
            self.ay2.grid(True)
        print(len(self.y1))
        print(self.y1)
        print(self.y2)
        #self.ay1.set_ylim([0,40])
        self.ay1.plot(self.y1)
        self.ay2.plot(self.y2)
        self.canvas_graph.draw()
        self.after(self.delay3, self.drawgraph)

    def callback_writecsv(self):
       self.thread2 = threading.Thread(target=self.writecsv)
       self.thread2.setDaemon(True)
       self.thread2.start()

    # CSVファイルへの書き出し
    def writecsv(self):
        # ファイル名の設定
        now = datetime.datetime.today()     #現在時刻取得
        hourstr = "_" + now.strftime("%H")  #時刻(時)を文字列化
        minutestr = "_" + now.strftime("%M")   #時刻(分)を文字列化
        filename = "temphumid_" + now.strftime("%Y%m%d") + hourstr + minutestr + ".csv"

        #csvファイルに書き込み
        with open(filename,'a',newline='') as f:  #csvファイルの生成
            writer = csv.writer(f)
            writer.writerow(["year","month","day","hour","minute","second","temp[℃]","humid[%]"])  #1行目:見出し
            sec = 0
            #while(minutestr == minutestr_ser):  #1分間データを書き込む
            while( sec <= self.xlim):  #plot期間分書き込む
                #情報の取得
                temp = float(self.temperature)    #温度
                humid = float(self.humidity)      #湿度
                now_ser = datetime.datetime.today()  #現在時刻
                #[年,月,日,時,分,秒,温度,湿度]
                data = [now_ser.year,now_ser.month,now_ser.day,now_ser.hour,
                             now_ser.minute,now_ser.second,temp,humid]
                #データの書き込み
                writer.writerow(data)  #1行目分のデータ追加
                f.flush()              #バッファ上のデータをファイルに書き出し
                #plot間隔を設定
                if self.interval.get() == "1秒":
                    sleep(1)
                    sec+=1
                elif self.interval.get() == "10秒":
                    sleep(10)
                    sec+=10
                else:
                    sleep(60)
                    sec+=60

                #表示
                print('--------------------------------')
                print(now_ser.strftime("%Y/%m/%d %H:%M:%S"))
                print("温度:{:.2f}C".format(temp))
                print("湿度:{:.2f}%".format(humid))
                print("Wtite in {:}".format(filename))

        print("End")

    def callback_capture(self):
       self.thread3 = threading.Thread(target=self.capture)
       self.thread3.setDaemon(True)
       self.thread3.start()

    # 映像表示画面のキャプチャボタンの処理
    def capture(self):
        ret, frame = self.vcap.read()
        frame = cv2.cvtColor(frame, cv2.COLOR_BGR2RGB)
        if ret:
            sec = 0
            if self.period1.get() == "1分":
                period = 60
            elif self.period1.get() == "10分":
                period = 600
            else:
                period = 3600
            while( sec <= period ):
                cv2.imwrite("frame-" + time.strftime("%d-%m-%Y-%H-%M-%S") + ".jpg", cv2.cvtColor(frame, cv2.COLOR_RGB2BGR))
                #撮影間隔を設定
                if self.interval1.get() == "1秒":
                    sleep(1)
                    sec+=1
                elif self.interval1.get() == "10秒":
                    sleep(10)
                    sec+=10
                else:
                    sleep(60)
                    sec+=60

    # 終了処理
    def _quit(self):
        GPIO.cleanup()
        self.quit()
        self.destroy()
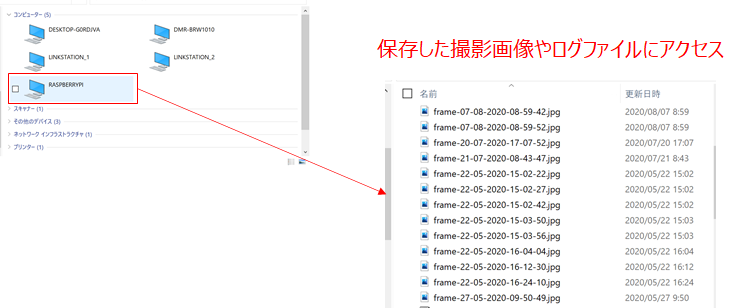
最後におまけで、Windowsのパソコンから保存したログファイルや画像ファイルにアクセスするために、ファイル共有(Samba)を使ってネットワーク経由でファイルにアクセスできるようにしました。
意外に使えるタッチパネル画面ができたと思います。
Tkinterを使ったタッチパネル画面は初めて作ったので、もうちょっといいやり方があると思います。もっといい方法などあれば、アドバイスいただけると助かります。
長くなりましたが、最後まで見ていただきありがとうございました。
Follow me!
はじめまして。
ラズパイでタッチパネルへデータ表示させるサイトを探していまして
ここを拝見しました。
実際プログラムを作成したのですが、時刻表示が動作しません。
「再帰関数で周期的に現在時刻を取得して表示」とありますが、
具体的なプログラムをもし宜しければお教えいただけないでしょうか?
ご質問ありがとうございます。
以下が実際に再起関数を呼び出している部分です。
↓メイン側で再帰関数を呼び出し
#時刻データを更新(1秒周期)
self.delay = 1000
self.updatetime()
↓以下が再起関数(updatetime)の中身です。
# 時刻更新
def updatetime(self):
self.datetime = str(datetime.datetime.now().strftime(“%Y/%m/%d %H:%M:%S”))
self.time.set(“現在時刻:” + self.datetime )
self.after(self.delay,self.updatetime)
以上、宜しくお願いします。
返信ありがとうございました。
早速試してみましたが、上手くいきませんでした。
まだpython初心者で、大変申し訳ありませんが具体的にどこの箇所に
プログラムを打ち込めば良いか教えていただけないでしょうか?
↓メイン側で再帰関数を呼び出し
#時刻データを更新(1秒周期)
self.delay = 1000
self.updatetime()
また以下のプログラムは、
# 時刻更新
def updatetime(self):・・・・
・・・ #main_frameを一番上に表示
self.main_frame.tkraise()
ここにいれています。
def updatetime(self):・・・・
宜しくお願い致します。
度々のコメントすみません。
時刻表示の件ですが、表示できるようになりました。
お手数おかけしました。
ありがとうございました!
すいません。今見ました…
解決できてよかったです。
また、何かあればご連絡ください。
また、教えていただければ嬉しいです。
次はグラフ表示させたいのですが、「frame5(グラフ表示の self.drawgraph()」
が必要だと思うのですが、勉強不足で分かりません。
サンプルプログラムがあれば教えていただけないでしょうか?
宜しくお願い致します。
drawgraph()の関数の中身は以下になります。
ご参考になれば幸いです。
—————————-
# グラフ描画
def drawgraph(self):
# X軸(plot期間)を設定:1分/10分/1時間
if self.period.get() == “1分”:
self.xlim = 60
elif self.period.get() == “10分”:
self.xlim = 600
else: # 1時間
self.xlim = 3600
if len(self.y1) <= self.xlim: self.ay1.set_xlim(0,self.xlim) self.ay2.set_xlim(0,self.xlim) self.y1.append(float(self.temperature)) self.y2.append(float(self.humidity)) else: self.y1.clear() self.y1.append(float(self.temperature)) self.ay1.clear() self.ay1.set_xlim(0,self.xlim) self.ay1.set_ylim([0,40]) self.ay1.set_title('plot') self.ay1.set_ylabel('Temp[℃]') self.ay1.grid(True) self.y2.clear() self.y2.append(float(self.humidity)) self.ay2.clear() self.ay2.set_xlim(0,self.xlim) self.ay2.set_ylim([0,100]) self.ay2.set_xlabel('Time[sec]') self.ay2.set_ylabel('Humidity[%]') self.ay2.grid(True) print(len(self.y1)) print(self.y1) print(self.y2) self.ay1.plot(self.y1) self.ay2.plot(self.y2) self.canvas_graph.draw() self.after(self.delay3, self.drawgraph) --------------------------------
読み込んでいる関数のコードを追記しておきました。
丁寧な対応ありがとうございます!
お手数おかけしました、大変勉強になりました。